Links
Archives
- 01/01/2004 - 02/01/2004
- 03/01/2004 - 04/01/2004
- 06/01/2004 - 07/01/2004
- 11/01/2004 - 12/01/2004
- 12/01/2004 - 01/01/2005
- 01/01/2005 - 02/01/2005
- 05/01/2005 - 06/01/2005
- 10/01/2005 - 11/01/2005
- 11/01/2005 - 12/01/2005
- 12/01/2005 - 01/01/2006
- 01/01/2006 - 02/01/2006
- 02/01/2006 - 03/01/2006
- 04/01/2006 - 05/01/2006
- 07/01/2006 - 08/01/2006
- 01/01/2008 - 02/01/2008
- 02/01/2008 - 03/01/2008
- 03/01/2008 - 04/01/2008
- 05/01/2008 - 06/01/2008
This rant is from the multiple political ideologies that live inside my head. They need a place to come out and play. (In a politically offensive way) Entry into this space is not advised!
Saturday, April 01, 2006
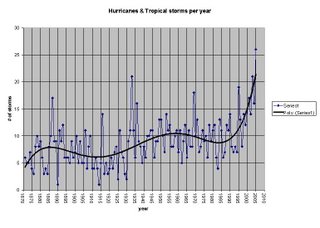
Here is the graph I have been trying to post, for about a year. (Click on it to enlarge) I have added the 2005 data point to it. It shows tropical storm activity since the late 1800's for the North Atlantic. The data is from the Hurricane Alley web site but is also available at wunderground.com.
(When a storm's winds reaches 39 mph it is called a tropical storm, it receives a name and may go on to form a Hurricane) When you look at the graph, it is pretty obvious that something is going on. (UPDATE: I HAVE MADE A SIGNIGICANT ERROR IN MY CALCULATIONS. I ACCIDENTLY INCLUDED TROPICAL DEPRESSIONS IN THE GRAPH. AGAIN THE GRAPH INCLUDES TROPICAL DEPRESSIONS, TROPICAL STORMS AND HURRICANES.)

When you also look at the graph of atmospheric Co2 levels it hard not to draw a correlation.

Here is another CO2 graph with the Ice core data overlaid.
Last September, Science magazine published an article on “Changes in Tropical Cyclone Number, Duration, and Intensity in a Warming Environment”
In it they stated that
“We conclude that global data indicate a 30-year trend toward more frequent and intense hurricanes, corroborated by the results of the recent regional assessment (29). This trend is not inconsistent with recent climate model simulations that a doubling of CO2 may increase the frequency of the most intense cyclones (18, 30), although attribution of the 30-year trends to global warming would require a longer global data record and, especially, a deeper understanding of the role of hurricanes in the general circulation of the atmosphere and ocean, even in the present climate state.”
From that article:
Here is a graph of intensities

And here also is a graph of ocean temperatures for the last 30 years.
IMHO, what is occurring is that man's activity has caused an extreme exacerbation of normal climatic variation.
Added factors to this already intense amount of hurricane activity is a La Niña that has formed in the Pacific and the start of a new sun spot cycle .
I do not fully understand the impact of La Niña on hurricane activity, but two separate predictions have indicated that the east coast is going to be more at risk this year (in addition to continued activity in the Gulf of Mexico).
AccuWeather
hurricanealley
For a previous post on hurricane predictions and their distortions click here
Note to the general public: I've done my part. Please take appropriate action to prevent your butt from being photographed by the MSM, as you scream for rescue atop of your flooded home.
Update: For an article by real climatologist on the link between climate change and hurricanes click on this link